
Eureka! You’ve just found the holy grail of market indicators. The indicator of indicators which over the past few days has perfectly called each 30 minute top and low in the e-mini S&P futures… Now what? Time to put some real money on the thing and retire to the islands…. Not so fast!
Your strategy may be looking good over the past few days, or even months or years. But to really get comfortable with it, wouldn’t you rather know how it has done over many, many years. And once you’ve done that, wouldn’t you rather see it work for a period of time on the current market before putting real money to work.
If you answered yes to either of those, welcome to the world of trading systems – because backtesting and forward testing are two of the biggest advantages of trading systems. The ability to see what would have happened, and what is happening – BEFORE putting real money to work. And then, the kicker… tracking your live account versus the trading system to see how you’re doing with that live money once you’re ready to take that next step.
Backtesting
Becktesting is just what it sounds like. Observing how a system would have performed going ‘back’ in the past, using historical prices to see when a system would have gotten in and gotten out, bought and sold, been stopped out, and so forth. By running the system backwards in time, an investor can compile all the different trades and calculate how much the system would have made and lost month by month, year by year – and from there calculate the statistics such as annual return and maximum drawdown and volatility and so forth we all use to gauge a model’s abilities. On the iSystems platform, every model, every modeal is backtested as far back as possible, ranging from 2001 to 2007, and shows in the equity curve graph and monthly perf table with a white background.
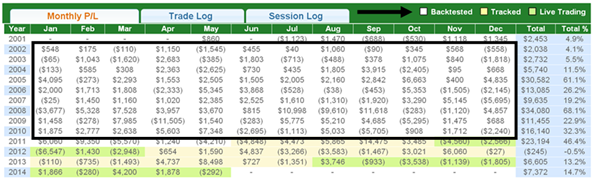
(Disclaimer: Hypothetical Model Account Performance)
Forward Testing:
So you’ve got the pretty annual return numbers, average winning amount, average losing amount, etc. – now what? The next step is forward testing the system to see how it reacts and how the code works in real time, on real live data. Not that we don’t trust computers… but we don’t. Who knows what sort of 1s and 0s could have swapped places and put some weird results into our backtested results. Better to see the thing working in real time to confirm that the risk controls are as they should be, that the algorithm can handle the live data feed, and so forth.
On the iSystems platform, whenever a system is approved and added to the platform, forward testing begins. This out of sample test can help confirm the effectiveness of the trading strategy on today’s market climate and expose any problems inherent in the code. The forward testing shows in the equity curve graph and monthly perf table with a peach background.
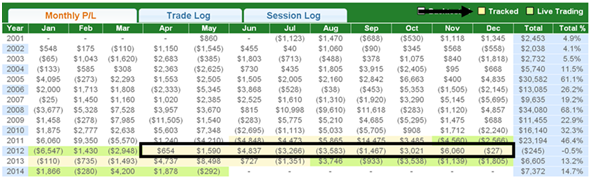
(Disclaimer: Hypothetical Model Account Performance)
Live Trading:
The only thing left is now is tracking the live trading. It’s putting real money to work and seeing what the real profit and losses are on each trade. And here’s where the iSystems platform really shines. You see – the platform tracks the actual fill prices for every client trading a particular system, then averages all of those prices to arrive at an average fill price, which it then uses to calculate the hypothetical profit or loss on a model account (an account starting at $20,000, for example). But that’s not all – the platform actually shows investors all of the good and bad fills too, listing the worst fill price and best fill price across all clients; and lists that side by side with the forward testing price (the price the computer ‘thought’ it was filled at). While they’re usually pretty close, there can be times where they are quite far apart too… the important part is having that data point, and being able to see how the live trading is tracking the backtest and forward test. The live trading shows in the equity curve graph and monthly perf table with a green background.
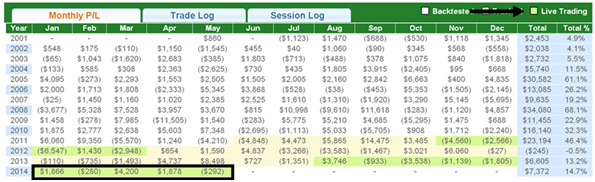
(Disclaimer: Hypothetical Model Account Performance)
Putting it all together: Wouldn’t it be nice if you could put all of these – the back test, the forward test, and the live trading fills onto one composite track record – with the different fill environments highlighted different colors to quickly and easily see the differences on the equity curve chart. We sure thought that would be cool, and that’s exactly what the iSystems platform does. The iSystems platform creates one track record containing all three types of fills.
It uses the Live Trading results to calculate monthly returns for any month in which any client, at any firm, is trading the system for the entire month. If there’s no client trading it in real time, it uses the forward testing, what it calls the tracked fills, for those months in which there are no client fills that month, or for the entire month. Finally, iSystems uses backtested fills (what it calls computer generated fills) for those months occurring before the system was loaded onto the iSystems trade servers. The resulting track record and monthly results are hypothetical in that they represent returns in a model account. The model account rises or falls by the single contract profit and loss achieved by the system in whichever data set is available, and begins with the Suggested Capital listed, then is reset to that amount each month. The percentage returns shown reflect the inclusion of commissions, fees, slippage, and the cost of the system; giving what we believe to be the most complete view of system performance available.
Here’s a glimpse of what an equity curve looks like highlighting backtesting, forward testing, and live trading using the different shades of color for the ExePi21CrudeCL system.
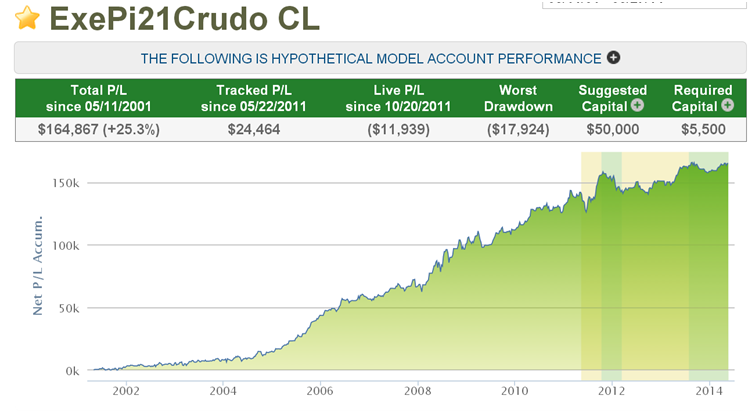
(Disclaimer: Hypothetical Model Account Performance)