
While the rest of the world is worried about the price of a stock, how much a certain market made or lost in a day, etc., system traders look at things a little differently. System traders spend the majority of their time looking at moving averages, the highs and lows of the day, and possibility of movement up and down.
They know they aren’t always going to win (does anyone besides the HFT firms like Virtu think they’re always going to win?), and it is typical for an average system to have a 60% win percentage or so. For this reason, it only makes sense for a systematic trader to want to capitalize off of the wins as much as possible – the closer your win percentage is to 50/50 – the more you need to make on your winners than you lose on your losers. Enter what we like to call the Dollar Range of a market. What’s the Dollar Range?
Well, let’s first start by explaining the range of a market. The range is simply the difference between a markets’ high price and low price for the day. For instance, if a trader is looking to find how much a commodity market moves up or down in the past 100 days, they will average the range of the past 100 days in the market. That’s what’s referred to in the industry, as the 100 Day Average True Range (ATR). The ‘true’ range part looks at the difference from yesterday’s close, in addition to each day’s high or low in case there was an overnight gap.
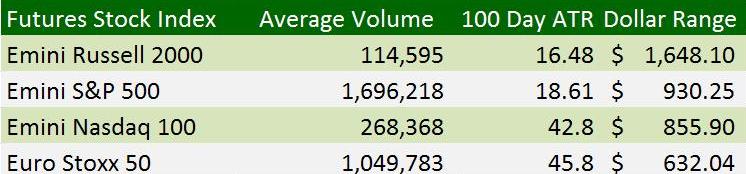
Now here’s where things get tricky. Because while the ATR of the Emini-S&P 500 futures contract is nearly three times less than the E-mini Nasdaq ATR; the emini S&P actually has a higher “Dollar Range” than the mini Nasdaq. You see – while the S&P has an ATR of around 18 and the Nasdaq is around 42 (nearly 3 times as high), they have different point values. This isn’t stock trading where a $1 move in price equals $1 times the number of shares. Here in the futures world, each different futures contract is worth a set amount of money, with the emini S&P worth $50 per point and the emini Nasdaq worth just $20 per point.
So in order to normalize things – you have to find the dollar range value – or simply, the ATR times the contract value in dollars. And here’s where things get really interesting… despite a fifteenth or so of the volume as the emini S&P 500 – the emini Russell 2000 futures have about twice the Dollar Range, and as noted above – the Nasdaq has less of a dollar range than the S&P despite the nearly 3 times higher average range.
 (Disclaimer: Past performance is not necessarily indicative of future results)
Many trading system developers have noticed this – and play their wares in the emini Russell futures, in order to get the most bang for their buck. If they are risking a set amount per trade (say $500) and looking to capture as much of the daily range as possible, it only makes sense to be looking at the emini Russell ($1,600+ possible profit / $500 risk = 3.2) instead of the emini S&P ($930/500 = 1.86).